WebMetabase is an application to archive, process, report and explore Metabolite Identification (Met ID) data from different experimental sources. Technically, it is a Java application that runs on a Java application server that connects to a database server, which is accessible to the user by a web browser. Therefore, WebMetabase is running on a internal server that should be reachable by anyone in the organization through the Intranet.
Since the application has been developed as independent of the database server, it can run in multiple systems (MySQL, Oracle, Microsoft SQL, etc..). Once the Java application and database servers are set up the deployment of the application is simple, reducing the maintenance time.
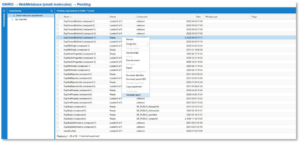
WebMetabase uses as input the files generated by MassMetaSite/Metabolite Pilot/Manually generated XML that can be automatically or manually upload to the server. The instruments are connected to a computer, where the raw data files are processed by Mass-MetaSite and the result files are sent to the WebMetabase server. Once the file is received by WebMetabase they are located in a section of the database call “Pending Experiments” waiting for the review and approval of the Met ID experts.
After the save and approval of the expert the state of the experiments is moved from “Pending” to “approved” and they are then visible to the rest of the organization.


WMB Training Documents:
- Tutorial_WMB_01. WebMetabase general definitions: Protocol definition
- Tutorial_WMB_02. MMS-WMB connection: The sample list and MMS batch process
- Tutorial_WMB_03. MMS-WMB connection: The sample list and MMS batch process II
- Tutorial_WMB_04. Automation Workflow: Starting an experiment from an instrument sample list
- Tutorial_WMB_05. GSH Experiment using the Autoprocess of the Batch Processor
- Tutorial_WMB_06 Approval process
- Tutorial_WMB_07. Analysis tools: Single Experiment
- Tutorial_WMB_08. Multi Experiment Analysis Tools: SMRt: Structure Metabolism Relationship table
- Tutorial_WMB_09. Multi Experiment Analysis Tools: Cluster View & Comparator
Articles:
- Prediction of peptide cleavage sites using protein language models and graph neural networks
- October 30, 2025. Paula Cifuentes, Ramon Adàlia, Ismael Zamora
- Automatic Identification of Lansoprazole Degradants under Stress Conditions by LC-HRMS with MassChemSite and WebChembase
- June 2021. Stefano Bonciarelli, Jenny Desantis*, Laura Goracci, Lydia Siragusa, Ismael Zamora, Elisabeth Ortega-Carrasco*
- Understanding the Metabolism of Proteolysis Targeting Chimeras (PROTACs): The Next Step toward Pharmaceutical Applications
- October 2020. Goracci L, Desantis J, Valeri A, Castellani B, Eleuteri M, Cruciani G.J
- Metabolite Identification Using An Ion Mobility-Enhanced Data-Independent Acquisition Strategy and Automated Data Processing. Rapid Commun Mass Spectrom
- June 2020. Radchenko T; Kochansky CJ; Cancilla M; Wrona MD; Mortishire-Smith RJ; Kirk J; Murray G; Fontaine F; Zamora I
- WebMetabase: cleavage sites analysis tool for natural and unnatural substrates from diverse data source
- February 2019. Radchenko T; Fontaine F; Morettoni L; Zamora I
- Software-aided workflow for predicting protease-specific cleavage sites using physicochemical properties of the natural and unnatural amino acids in peptide-based drug discovery
- January 2019. Radchenko T; Fontaine F; Morettoni L; Zamora I
- Software-aided approach to investigate peptide structure and metabolic susceptibility of amide bonds in peptide drugs based on high resolution mass spectrometry
- November 2017. Radchenko T; Brink A; Siegrist Y; Kochansky C; Bateman A; Fontaine F; Morettoni L; Zamora I
- Enabling Efficient Late‐Stage Functionalization of Drug‐Like Molecules with LC‐MS and Reaction‐Driven Data Processing
- European Journal of Organic Chemistry, 2017. Huifang Yao, Yong Liu, Sriram Tyagarajan, Eric Streckfuss, Mikhail Reibarkh, Kuanchang Chen, Ismael Zamora, Fabien Fontaine, Laura Goracci, Roy Helmy, Kevin P. Bateman, Shane W. Krska
- Development, optimization and implementation of a centralized metabolic soft spot assay
- April 2017. Paiva AA; Klakouski C; Li S; Johnson BM; Shu YZ; Josephs J; Zvyaga T; Zamora I; Shou WZ
- Metabolism study and biological evaluation of bosentan derivatives
- October 2016. Lepri S, Goracci L, Valeri A, Cruciani G.
- Enhancing throughput of glutathione adduct formation studies and structural identification using a software-assisted workflow based on High Resolution Mass Spectrometry (HRMS) data
- October 2016. E.N. Cece-Esencan, F. Fontaine, G. Plasencia, M. Teppner, A. Brink, A. Pahler, I. Zamora.
- Software-aided cytochrome P450 reaction phenotyping and kinetic analysis in early drug discovery
- January 2016. Cece-Esencan EN; Fontaine F; Plasencia G; Teppner M; Brink A; Pähler A; Zamora I
- Software-aided structural elucidation in drug discovery
- November 2015. Ahlqvist M; Leandersson C; Hayes MA; Zamora I; Thompson RA
- Post-acquisition analysis of untargeted accurate mass quadrupole time-of-flight MS(E) data for multiple collision-induced neutral losses and fragment ions of glutathione conjugates
- December 2014. Brink A; Fontaine F; Marschmann M; Steinhuber B; Cece EN; Zamora I; Pähler A
- High-throughput, computer assisted, specific MetID. A revolution for drug discovery
- Spring 2013. Zamora I; Fontaine F; Serra B; Plasencia G
- Software automation tools for increased throughput metabolic soft-spot identification in early drug discovery
- May 2013. Zelesky V; Schneider R; Janiszewski J; Zamora I; Ferguson J; Troutman M
- Update on hydrocodone metabolites in rats and dogs aided with a semi-automatic software for metabolite identification MassMetaSite
- May 2013. Li AC; Chovan JP; Yu E; Zamora I
- Enhanced metabolite identification with MS(E) and a semi-automated software for structural elucidation
- November 2010. Bonn B; Leandersson C; Fontaine F; Zamora I
Posters:
- Software-aided approach designed to analyze and predict cleavage sites for peptides
- 73rd ASMS Conference on Mass Spectrometry. June 2025. Paula Cifuentes; Ramon Adalia; Ismael Zamora; Lisa O’Callaghan, Richard Gundersdorf
- Automation in Metabolite Identification Workflows with Software-Assisted Processing of Mass Spectrometry Data
- 73rd ASMS Conference on Mass Spectrometry. June 2025. Savannah M Mason; Ismael Zamora; Luca Morettoni; Paula Cifuentes; Ramon Adalia
- An automated software-assisted approach for exploring metabolic susceptibility and degradation products in macromolecules using High-Resolution Mass Spectrometry
- 72nd ASMS Conference on Mass Spectrometry. June 2024. Paula Cifuentes; Ismael Zamora; Fabien Fontaine; Albert Garriga; Luca Morettoni; Tatiana Radchenko
- Machine Learning-Assisted False Positive Detection in Metabolite Identification Workflows
- 72nd ASMS Conference on Mass Spectrometry. June 2024. Ramon Adàlia; Fabien Fontaine; Luca Morettoni; Ismael Zamora
- Automation of Routine HRMS Analysis using MassChemSite and WebChembase using lansoprazole forced degradation as case study
-
August 2021. 61st Annual Land o’ Lakes Pharmaceutical Analysis Conference. Elisabeth Ortega-Carrasco, Luca Morettoni, Fabien Fontaine, Ismael Zamora
-
- Automation of data analysis in High-Troughput Experimentation using WebChembase server application
- ESOC 2021. European Symposium on Organic Chemistry. Virtual Mini Symposium. July 2021
- A Case Study Of The MassChemSite Reaction Tracking Workflow: Detecting And Identifying Byproducts During PROTAC Synthesis
- 68th ASMS Conference on Mass Spectrometry and Allied Topics Reboot. Online. June 2020
- Automatization of structural elucidation workflow for detecting degradation impurities in Peptides
- February 2020. Elisabeth Ortega-Carrasco, Blanca Serra, Ismael Zamora
- High resolution Mass Spectroçmetry with automated data analysis to support structural elucidation of degradation impurities of small peptides
- AAPS 2019 PHARMSCI 360, San Antonio (United States of America)… 03 November, 2019
- Software assisted analysis for Peptide Catabolism
- Institute for Research in Biomedicine (IRB Barcelona) 35 EPS European Peptide Symposium, Dublin (Ireland) … August 2018
- Peptide catabolite identification using HDMSE Data and MassMetaSite processing
- 66th ASMS Conference on Mass Spectrometry and Allied Topics, San Diego (United States of America) … 06 June 2018
- Structural Elucidation Tools To Enhance Organic Synthesis Productivity
- 66th ASMS Conference on Mass Spectrometry and Allied Topics, San Diego (United States of America). 06 June 2018
- Towards an automatic structure elucidation process in various chemical workflows by LC-HRMS and NMR data analysis
- 254th ACS National Meeting, Washington DC (United States of America) 20 August 2017
- An innovative algorithm to elucidate the structure of unknown compounds using tandem Mass Spectrometry and NMR data
- 65th ASMS Conference on Mass Spectrometry and Allied Topics, Indianapolis, IN (United States of America) 04 June 2017
- Peptide metabolism: High resolution mass Spectrometry tool to investigate peptide structure and amine bond metabolic susceptibility
- American Peptide Symposium, Whistler (Canada)… 17 June 2017
- Peptide metabolism: Identification of Metabolite structures of GLP-1 receptor agonists in different in-vitro systems using high resolution mass spectrometry
- 64th ASMS Conference on Mass Spectrometry and Allied Topics, San Antonio, TX (United States of America) … 05 June 2016
- Kinetic analysis during the metabolite identification process
- 05 June 2016. 64th ASMS Conference on Mass Spectrometry and Allied Topics, San Antonio, TX (United States of America)
- Development of higher-thoughput metabolic soft spot assay with integrated assessment of Glutathione adduct formation
- 05 June 2016. 64th ASMS Conference on Mass Spectrometry and Allied Topics, San Antonio, TX (United States of America)
Videos:
- Scalable Peptide MRM Transition Prediction for High-Throughput Proteomics via Hashing-Based Sequence Encoding
- 73rd ASMS Conference on Mass Spectrometry. June 2025
- Oniro: automation and standardization for workflow definition
- Customizable spectra signal colors
- WebMetabase & WebChembase: Fragment analysis validation for manual edited compound
- Compound Library: automation of Compound set definition
- Automation of Metabolite Identification
- Practical Applications for Drug Discovery 2020 Webinar. Ismael Zamora
- Spatial Localization and identification of Drug and Metabolites
- Practical Applications for Drug Discovery 2020 Webinar. Sara Tortorella, Giulia Coliva
- PROTAC Metabolite Identification
- Practical Applications for Drug Discovery 2020 Webinar. Ismael Zamora
- DMPK Workflows: HT MS For Clearance Determination
- Practical Applications for Drug Discovery 2020 Webinar. Ismael Zamora
- Forced Degradation Studies For Chemicals
- Practical Applications for Drug Discovery 2020 Webinar. Elisabeth Ortega-Carrasco
- Metabolite ID For Peptides Made Simple
- Practical Applications for Drug Discovery 2020 Webinar. Tatiana Radchenko
- Proprietary Peptide Visualization Within MassMetaSite
- Practical Applications for Drug Discovery 2020 Webinar. Tatiana Radchenko
- PROTAC Analysis: Analysis Of Chemical Reactions
- Practical Applications for Drug Discovery 2020 Webinar. Elisabeth Ortega-Carrasco
- Late Stage Functionalization Automation Of MS Driven Structure Elucidation
- Practical Applications for Drug Discovery 2020 Webinar. Elisabeth Ortega-Carrasco
How do I extract ions in the Chromabrowser?
You can type the m/z, the molecular formula, or the formula change (+O, -2H, etc). You can also use the following abbreviations:
“+GS” -> “+C10H15N3O6S”
“+GLUCYS” -> “+C8H12N2O5S”
“+CYSGLY” -> “+C5H8N2O3S”
“+CYS” -> “+C3H5NO2S”
“+NAC” -> “+C5H7NO3S”
“+GS+H” -> “+C10H16N3O6S”
“+GLUCYS+H” -> “+C8H13N2O5S”
“+CYSGLY+H” -> “+C5H9N2O3S”
“+CYS+H” -> “+C3H6NO2S”
“+NAC+H” -> “+C5H8NO3S”
“+GLY” -> “+C2H3NO”
“+TAUR” -> “+C2H5NO2S”
“+GLN” -> “+C5H8N2O2”
“+ACET” -> “+C2H2O”
“+GLUC” -> “+C6H8O6”
“+CO2+GLUC” -> “+C7H8O8”
“+GLC” -> “+C6H10O5”
What are the server requirements to run WebMetabase?
The platform needed to host Oniro has these minimum requirements:
- Windows or Linux platform (64 bits)
- 8 (or more) CPU core
- 16 (or more) Gb of RAM
- 500 Gb of disk space (1.5 Tb or more if the database server has to run on the same machine)
Oniro application needs the following software to be installed prior to its deployment:
Java JDK/OpenJDK (could run on JRE too), version 8 minimum; 64 bit platform is needed,
Application Server, Apache Tomcat (version 8 or 9)
Database system: The database can be installed in the same computer as the Application Server or at an external machine or cluster (having a good connection to the Application Server).
WebMetabase can be used in the following database systems:
- MySQL
- Oracle
Can I import "Process Settings" from MassMetaSite into WebMetabase?
Yes. Settings should be imported as .set or .cset files.
Instructions
- Export the settings from MassMetaSite.
- Within Oniro, navigate to WebMetabase –> Settings –>MassMetaSite Settings.
- In the list of Saved Settings on the left, right click and select “Import Settings”
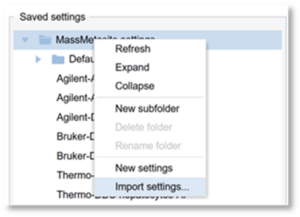
4. Provide a name for the process settings and browse to find the file. Then click OK.
The settings have now been imported and can be used within WebMetabase.
Can I change the columns in the Chromatable?
Yes, you can change both the content and the order of columns in the Chromatable.
Instructions
- In the header for any column of the table, click the arrow to the right.
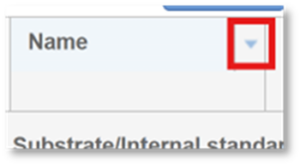
2. In the new menu, navigate to Columns. Here, you will see the list of available columns. Use the check boxes to select or deselect columns.
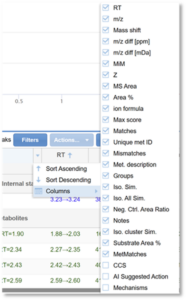
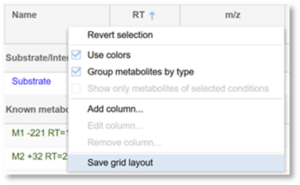
3. To re-order the columns, click the header of a column and drag it to the desired location in the table.
4. If you would like to save this layout for the experiment, right click on any column header and click Save grid layout.
Can I change the colors used for the spectra?
Yes, the colors used for the spectra can be changed. Keep in mind that these changes will go in effect for all users on the WebMetabase server.
Instructions
- Within WebMetabase, go to Settings à Experimental data.
- On the bottom right is a section called Custom spectra colors.
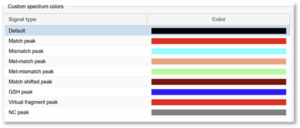
3. Click on each row to customize the color for each type of signal.
4. Click Save before exiting.
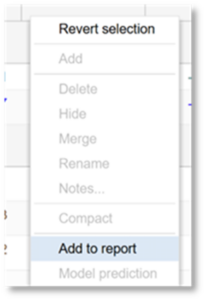
How do I export the information in the Chromatable to an Excel report?
The information in the Chromatable can be exported to an Excel report from both pending and approved experiments.
Instructions
- Right click on any row in the Chromatable. Then click Add to report.
2. In the new window, provide a Report Name.
3. Select the columns that you would like included in the report. The Column titles listed in the right-hand panel are those which will be included in the report. The Columns listed in the left-hand panel are the remaining options for columns, which will not be included in the report. Use the arrows in the center to move the columns as desired.
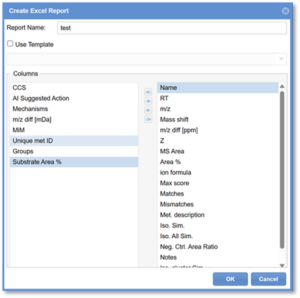
4. Click OK.
5. You will automatically be taken to the Analysis tools tab of the experiment, where you can see the Excel report in the list of analysis tools executions.
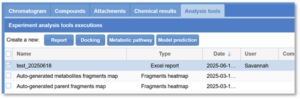
6. Double click the line to open the report. Click Export on the bottom right if you would like to export the report as an Excel file.
How do I add a new metabolite peak?
Instructions
- In a Pending experiment in WebMetabase and go to the Chroma-browser tab.
- In the Signals panel on the left, right-click on one of the signals and click Extract chromatogram.
- In the new window, select the m/z you want to extract. There are a number of ways to do this. Click OK.
- Check the box for the signal you want to visualize in the center of the screen.
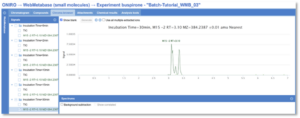
5. Click and drag across the EIC to zoom. Click on the signal in the chromatogram so that it appears bold.
6. Click and drag across a peak to integrate it. The peak will appear shaded.
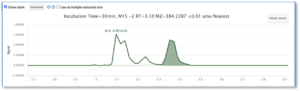
7. Click the Generate button at the top.
8.Click the Run MassMetaSite radio button at top. Then examine the chromatograms and re-integrate any signal as needed. Then click Execute. MassMetaSite will now process the new peak. A window will pop-up to say when the processing is complete and the compound has been added to the experiment.
The new metabolite will appear in the list of metabolites, and the fragmentation analysis will be provided as it is for any previously detected metabolite.
How do I manually edit a metabolite?
Instructions
- In a Pending experiment in WebMetabase, go to the Compounds tab, and select a metabolite to edit.
- Click the Edit button near the top.
- Use the structure editor to manually edit the metabolite structure. The information in the table on the bottom will automatically be updated as you edit the structure.
- Click the Fragmentation button at the bottom. A window will first pop up with settings for the fragmentation analysis. Edit the settings as desired and click OK. Now you can visualize the fragmentation analysis for the newly drawn structures.
- Click Save on the fragmentation window and Save in the structure editor window.
The structure of the compound will now appear updated, and the new fragmentation analysis will be provided as it is for any other metabolite.
How do I import a new report template?
First, your user must have permissions in order to use the reporting system, so you will need to log into Oniro as an admin user and give the right permissions to the user.
The permissions you must activate for your user are “Report templates” and “Report writer”. “Report templates” will allow you to import the report templates into the system, and “Report writer” allows you to use them in experiments.
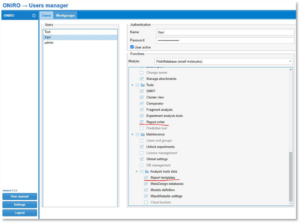
Instructions
- Once your user has the permissions, go to the WebMetabase (small molecule) module, click on the Settings button, and then navigate to the “Report templates” tab. Here, you will manage all the templates to be used for creating reports.
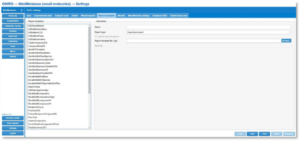
2. In order to upload a report template, provide a name for the new template in the text box “Name”, and select the type of report. In the present version of WebMetabase, there are two report types: Experiment report—to be applied to a single experiment—and Multi experiment report—to be applied to a group of experiments. The “Experiment report” is the option you will use most of the time.
3. Click the Browse button to select a zip file, which we will provide you, to upload the template.
4. Click the Save button. This will upload the files into the server so that the report template is available to everyone.
- New: to start a new report template upload
- Delete: to delete the template from the database
- Download: downloads all the files of the template to the user’s computer
- Close: to exit of the report templates manager.
How do I create new reports with existing templates?
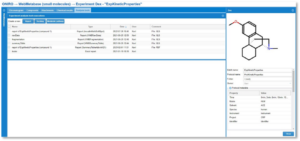
When you have some template files in WebMetabase, you are ready to create your reports. There are two different ways to create reports: by opening the approved experiments or by right clicking on the list of experiments you have in pending or approved.
Instructions
- When you open an approved experiment, go to the ‘Analysis tools’ tab. Click on the Report button, and a dialog window will appear.
2. From this dialog window, select the options to generate the report. Some options are set by default, and we will explain in detail what each one means:
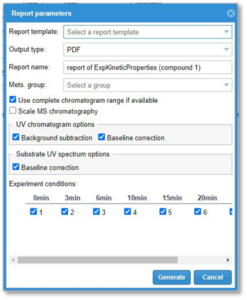
- Report template: The user can select from the templates uploaded to the system.
- Output type: The user can select to output the report in different formats: PDF, XML, Excel, Word or PowerPoint.
- Report name: The user can type the name of the report file.
- Mets group: The user can select the metabolite groups, if any, to be reported.
- Use complete chromatogram range if available: Check this check box in order to draw the chromatograms in the report with the full time range. This option is only available after the MassMetaSite 3.2 version uploaded files.
- Scale MS chromatography: Check this check box if the user wants to have a single scale for the chromatography.
UV chromatogram options
- Background subtraction: When UV data are available, check this box to draw the chromatogram by subtracting the chromatogram of the parent sample.
- Baseline correction: When UV data are available, check this box to draw the chromatogram by doing a correction in the baseline.
Substrate UV spectrum options
- Baseline correction: When UV data are available, check this box to draw a baseline-corrected UV spectra.
- Experiment conditions: This option is only shown if there is more than one sample within an experiment. There is a check box next to each condition, and the user can select which conditions should be included in the report.
- Generate: Click this button to generate the report. After the selection is done, a file with the specified name and options will be downloaded from the server to the client computer. Typically, it will be saved under the Downloads folder.
- Cancel: Go back to the previous window without generating the report.